Written by: Pierce Young
For decades, wildlife managers have relied on tools such as camera surveys to help estimate deer populations.
Now, another tool is becoming increasingly available:
Thermal-imaging drones.
The technology is exciting—but there is an important distinction between using a drone to find deer and using a drone to scientifically estimate a deer population.
Those are not necessarily the same thing.
Recent research from Auburn University's Deer Lab provides some of the first experimental evidence showing that thermal drones can produce accurate and precise estimates of deer density when the survey is designed correctly.
A drone equipped with a thermal camera can fly over a property at night and detect the heat signatures of deer below. Instead of trying to determine how many deer are using a property from counting hundreds or thousands of photographs managers can fly a strategic portion of the property and count deer that are detected within a surveyed area.
That research is particularly important because, until recently, there was relatively little research demonstrating how accurate thermal-drone deer surveys actually were or how survey design affected the reliability of the resulting population estimate. The researchers themselves noted that, although drones had considerable potential for wildlife surveys, the precision and accuracy of drone-based deer density estimates had not been extensively tested.
In other words, the technology existed before we had a good scientific answer to a very basic question:
If a drone company tells you there are a specific number of deer on your property, how do you know that is accurate?
That is where the science becomes important.
Finding Deer Is Not the Same as Estimating Deer
Imagine flying a thermal drone over a 1,000-acre property and finding 100 deer.
It may be tempting to say:
"We found 100 deer, so there must be 100 deer on the property."
But that conclusion may be completely wrong.
Perhaps...
- the drone only surveyed a portion of the property
- deer were concentrated in one part of the property that night.
- the flight paths were too far apart.
- some deer were missed because of vegetation.
- the same deer were counted twice.
- the drone disturbed deer before they were detected.
- the survey was conducted during a time of year when leaves blocked the thermal sensor.
- the person reviewing the video missed some of the deer.
- or many other potential variables
The number of deer seen by a drone is therefore not automatically the population estimate.
Why Standardization Matters
As thermal drones have become more affordable and accessible, companies and individuals have been offering drone-based deer surveys.
That is a positive development.
However, a major problem has been the lack of a standardized, research-tested protocol.
Different operators may use different:
- Flight altitudes
- Flight speeds
- Transect spacings
- Flight patterns
- Survey seasons
- Survey times
- Methods for counting deer
- Methods for calculating surveyed area
- Numbers of survey flights
Two companies could therefore fly the same property and produce substantially different population estimates simply because they used different methods.
And without knowing the actual number of deer present, it can be difficult to determine which estimate is correct.
This is one of the most important contributions of the Auburn research.
They tested the method on a high-fenced properties where the deer populations were known.
They were also tested in conjunction with camera surveys for comparison since they have been proven through research to be 90% accurate.
That allowed them to compare the drone estimate against an independent estimate of the actual deer density.
What Was Tested
Auburn University Deer Lab evaluated thermal-drone line-transect surveys for estimating white-tailed deer abundance.
Those estimates were very close to the independent estimate, demonstrating that properly designed thermal-drone surveys can produce highly accurate estimates of deer density.
That is a significant finding for wildlife managers.
Auburn's research found that transect spacing had a major influence on precision.
At the Auburn Captive Facility, nightly estimates found they could produce precise estimates with as few as two flights.
The Bottom Line
Thermal drones are an exciting new tool for deer managers.
But the important breakthrough is not simply that drones can see deer.
We already knew that.
The important breakthrough is that recent research is beginning to show how drones can be used to produce scientifically defensible estimates of deer density.
A thermal drone is a tool.
The survey protocol is what turns that tool into a population-estimation method.
-
A Practical Protocol for Estimating Deer Populations With a Thermal Drone
This guide explains how wildlife managers estimate deer abundance using a drone equipped with a thermal camera following the protocol established by Gerena et al. (2025) – An Evaluation of Line Transect Sampling Using Drone with Thermal Sensors for Estimating Deer Abundance [Auburn University].
1. When to Fly
Season:
- Fly when trees have lost their leaves if flying in wooded areas
- Late winter (approximately late-December through late-February)
Time of day:
- Immediately following last light (after sunset) or before sunrise
Why:
- Deciduous trees have lost leaves, reducing visual obstruction
- Deer body heat contrasts strongly with cooler ground and vegetation at night
- Deer are still active shortly after sunset
2. Break the Property into Survey Blocks
- Divide the property into survey blocks based on drone model’s range and battery life
- Survey blocks represent area flown in one instance with one battery
- Survey blocks should be spaced apart based on viewing window size
- Randomize the order in which blocks are flown nightly
Example:
- Divide the property into survey blocks of approximately 100 acres.
- Separate blocks by about 500 feet to reduce the risk of counting the same deer twice.
- Block size is limited by:
- Drone battery life (≈30 minutes depending on model)
- Signal range (10 km depending on model)
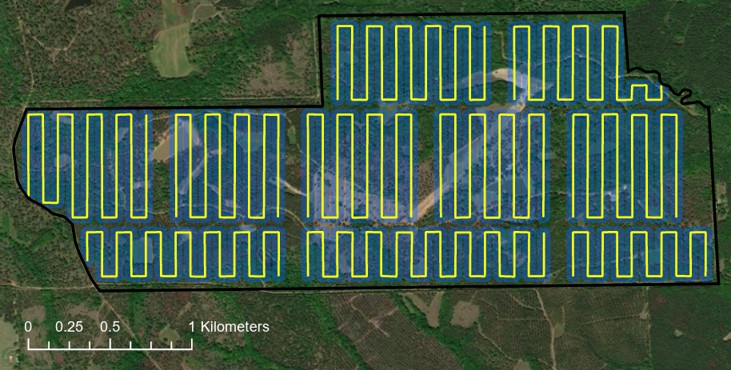
3. Pre-Program the Flight Paths (Transects)
- All flights are planned and loaded onto drone controller before going to the field.
- Straight-line transects are preferred, and these transects are spaced based on the drone’s viewing window such that they do not overlap and deer are not counted twice.
- More closely spaced transects (that do not overlap) result in more precise estimates with fewer samples
- Transect length is limited by drone signal range and battery life
How to plan flights:
- Open a GIS or mapping program (e.g., ArcGIS, Google Earth).
- Overlay a 250 ft × 250 ft grid across the survey area (for drone flown at 300ft AGL with 225ft x 225ft viewing area)
- Draw straight-line, parallel flight paths (transects) across each survey block.
- Use 250 feet transect spacings (each straight-line segment is spaced 250ft apart).
- Ensure transects do not overlap based on the camera’s viewing width.
- Export transects as a KML file.
- Load the KML into the drone’s flight-planning software or controller
Note: 250ft transect spacings were chosen based on an approximate viewing window of 225ft by 225ft resulting from flying a DJI Mavic 2 Enterprise Advanced at 300ft above ground level.
Example:
- No point on the transect should be farther than 10km from the starting point/controller
- Flight paths should be less than 20,000ft in total length
4. Drone Flight Settings
Use identical flight settings for all surveys.
- Altitude: ~300 feet above ground level
- Speed: ~18 mph
- Camera angle: Straight down (nadir)
- Resultant viewing window on ground: Approximately 225 ft × 225 ft
These settings were chosen through trial flights to minimize downtime while keeping deer clearly identifiable.
5. Collect Video and Still Images
Thermal Video
- Record continuous thermal video for the entire flight.
- Thermal video is the primary data source for deer counts.
- Screen record live feed if necessary
Still Images
- If desired, capture one still image every 3 seconds.
- Still images provide:
- Documentation
- Backup verification of detections
6. Launching the Drone
- Launch the drone outside the survey block or away from target animals
- This reduces disturbance and limits deer movement caused by the aircraft.
7. Review the Footage and Count Deer
- A single trained observer reviews the thermal video.
- Video is viewed at normal speed but may be:
- Paused
- Rewound
- Slowed as needed
- Deer appear as bright heat signatures against greyscale background (white hot).
- Count only deer detected within each survey block.
- Record counts separately by:
- Block
- Survey night
8. Calculate the Area Surveyed (Step-by-Step)
This step defines how much land was actually sampled (survey area).
How area is calculated:
- Take each flight line (transect).
- Create a buffer 225 feet wide around the line to represent the sensor’s viewing window.
- Clip the buffer to stay within property boundaries if needed.
- Use GIS tools (calculate geometry attribute) to calculate the total buffered area for combined viewing windows (such as in ArcGIS, Google Earth, or other mapping tool).
This total buffered area is the area surveyed.
9. Calculate Deer Density
For each survey night:
Deer Density = Number of Deer Observed ÷ Area Surveyed
- Density can be expressed as deer per acre or deer per square mile.
Example:
- If the drone detects 30 deer over 300 surveyed acres: 30 ÷ 300 = 0.10 deer per acre
10. Estimate Total Deer Numbers
Multiply deer density by the total property area:
Estimated Population = Deer Density × Total Area
Example: 0.10 deer/acre × 1,000 acres = 100 deer
- Estimates are calculated for each night.
- Nightly estimates are averaged to produce a site-level estimate.
- Variation among nights is used to quantify uncertainty.
11. How Many Nights Should You Fly?
- Gerena et al. surveyed multiple nights (minimum of 2-4 nights) with the entire property flown once per night.
- Precision improves as more nights (or samples) are added.
- Wider spaced transects require more nights of sampling.
- Survey precision should be evaluated by:
- Comparing night-to-night variation
- Calculating the coefficient of variation (CV)
12. Average the Nightly Estimates
Suppose your survey produces:
- Night 1: 96 deer
- Night 2: 103 deer
The mean estimate is: 99.5 deer
13. Calculate the Coefficient of Variation
The coefficient of variation, or CV, is a useful way to describe how much the estimates vary relative to their mean.
In simple terms:
Lower CV = more precise estimate
Higher CV = less precise estimate
This gives wildlife managers a way to report not just:
"We estimate 100 deer."
but something more informative:
"We estimate approximately 100 deer, and repeated surveys produced relatively little variation around that estimate."
That distinction is important when making management decisions.
Calculate using this formula: Coefficient of Variation = Standard Deviation ÷ Average
Use the Estimate as a Management Tool—Not a Stand-Alone Answer
Finally, remember what the drone survey is actually telling you.
A population estimate is only one piece of the management puzzle.
Once you have an estimate of deer abundance, compare it with:
- Habitat condition
- Browse pressure
- Forest condition
- Food availability
- Body weights
- Fawn recruitment
- Doe ratio
- Harvest data
- Deer observations
- Management objectives
The goal is to determine the deer density that is appropriate for the habitat and the landowner's objectives.
Primary Research Citation
Gerena, K. R., Newbolt, C. H., Gitzen, R. A., & Ditchkoff, S. S. (2025). An evaluation of line transect sampling using drones with thermal sensors for estimating deer abundance. Wildlife Research, 52(11), WR25013. https://doi.org/10.1071/WR25013.